Results
- Comparison of different loss functions and backbone networks. Our loss works universally with many backbones.

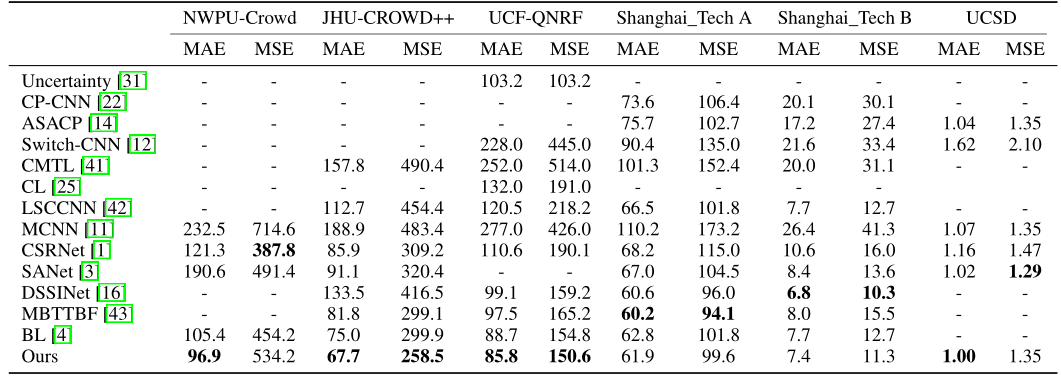
- Comparison with state-of-the-art. Using the same network architecture, using our loss outperforms the baseline (Bayesian Loss, BL) on the three largest datasets.

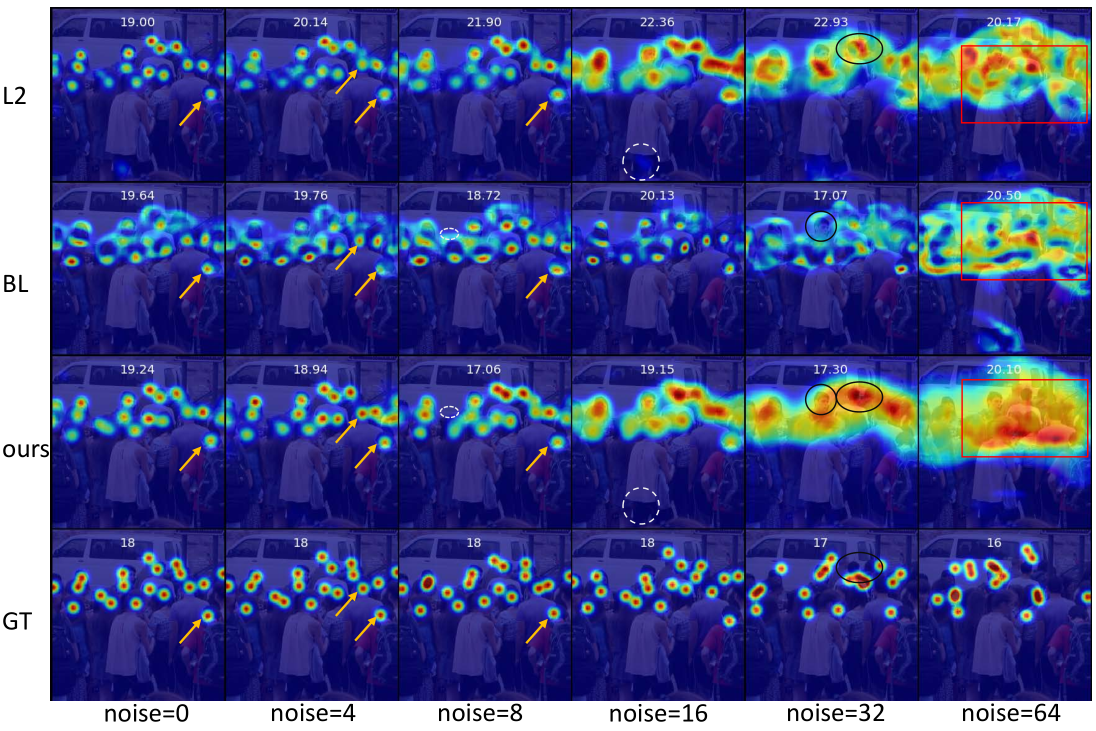
- Visualization: Visualization of density maps predicted from models trained with different loss functions and noise levels. (yellow arrow) the annotations are not at the center of heads and our method can move those dots toward heads’ center, while BL cannot move them and L2 is less confident. (white dash ellipse) other methods have more false positive than ours. (black solid ellipses) when there is large annotation noise, the head region of our prediction is larger than the surrounding background, while others are the opposite. (red rectangle) since the annotation is very noisy, other method are confused about the foreground and background regions, while our prediction is roughly correct and smoother than others.

