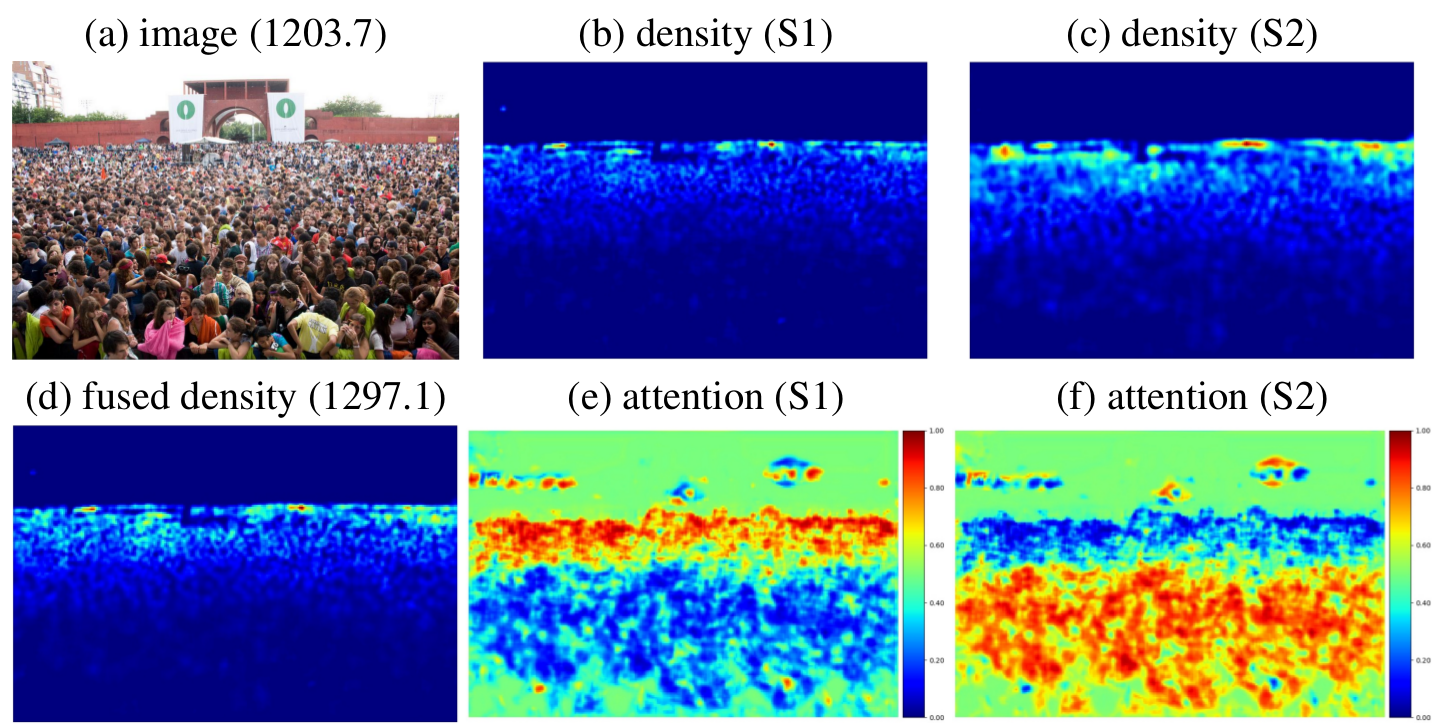
- Example of our image pyramid CNN (FCN-7c-2s) showing the predicted attention maps (e, f), density predictions (1-channel feature map) of each scale (b, c) and the final fused density map (d). Numbers inside the parenthesis are the GT density and predicted density.
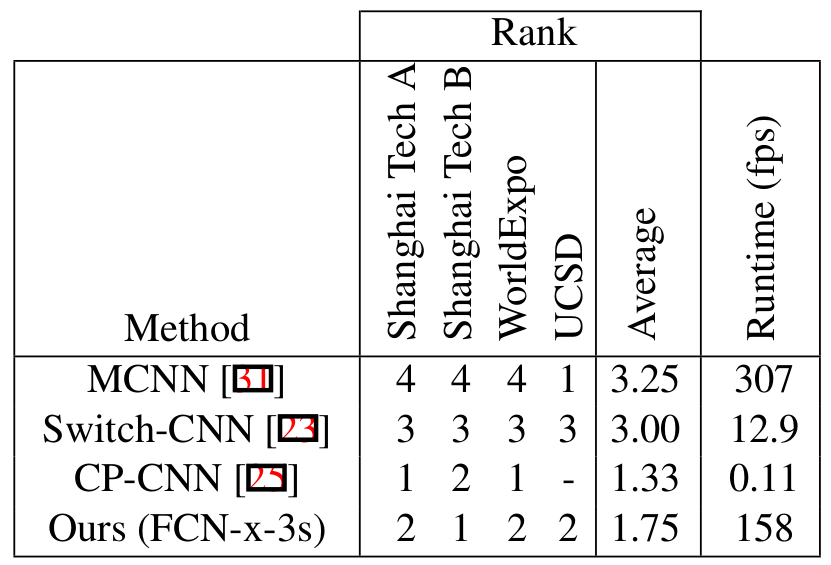
more results in the supplementary - Comparison of the four most competitive methods. All runtimes are using PyTorch 0.3.0 on a GeForce GTX 1080 on 1024×768 images. Methods without published code were built (without training) and speed tested in the prediction stage.
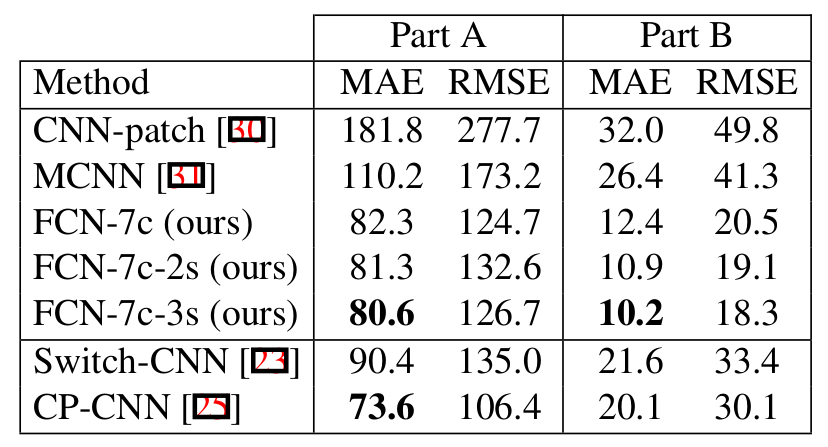
- Test errors on the ShanghaiTech dataset. “2s” and “3s” indicate using 2 or 3 different scales in the image pyramid. Switch-CNN and CP-CNN both use pre-trained VGG network.
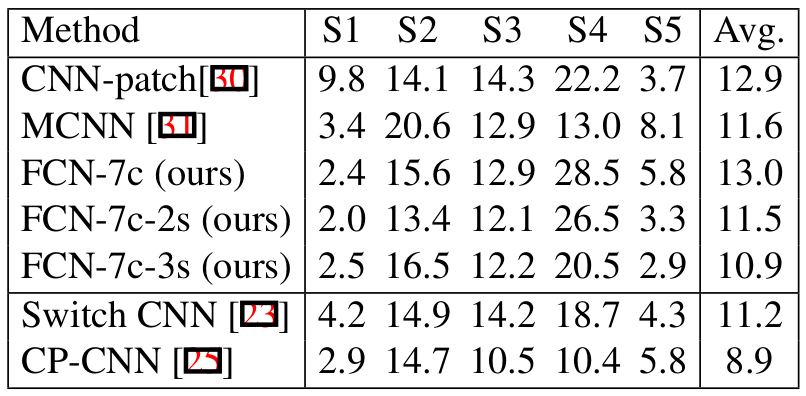
- MAE on WorldExpo dataset. Only results using the same ground truth densities as the original paper are included. Other methods are not comparable since they use different ground-truth counts due to different ground-truth densities.
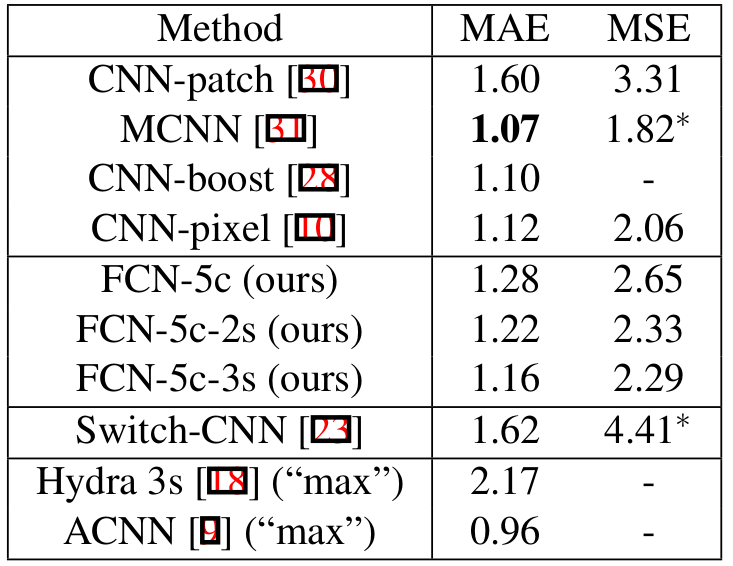
- Test errors on the UCSD dataset when using the whole training set. “max” means the methods are trained on the downsampled training set, where only one out of 5 frames is used for training.