These are demo videos for the TCSVT journal paper, “Counting People Crossing a Line using Integer Programming and Local Features.” The result video is available in “.mov” format. The datasets are available here.
1. Results for USCD Dataset
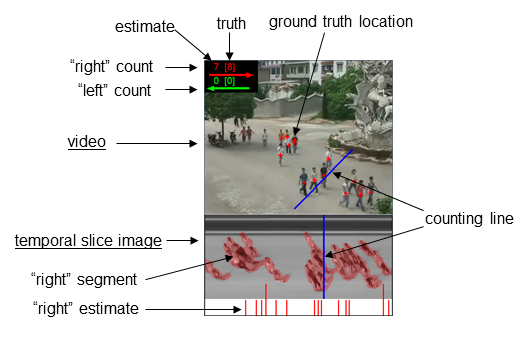
video ucsd.mov – counting results for the UCSD pedestrian dataset (2000 frames), with 1200 frames for testing and 800 frames for training. An example video frame is shown below:
[mov (13.1 MB)]
Instantaneous count results
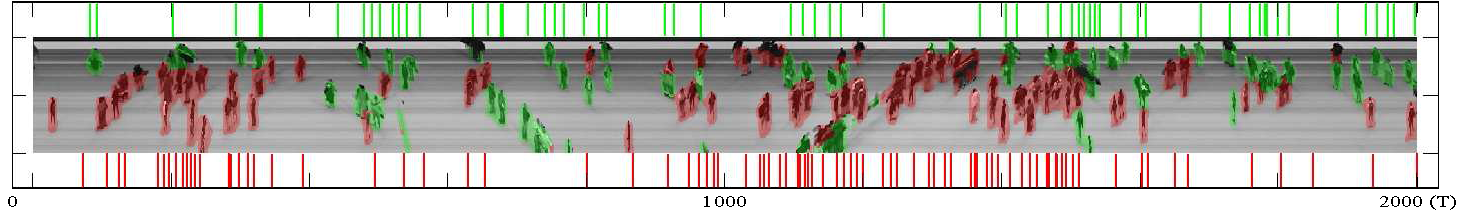
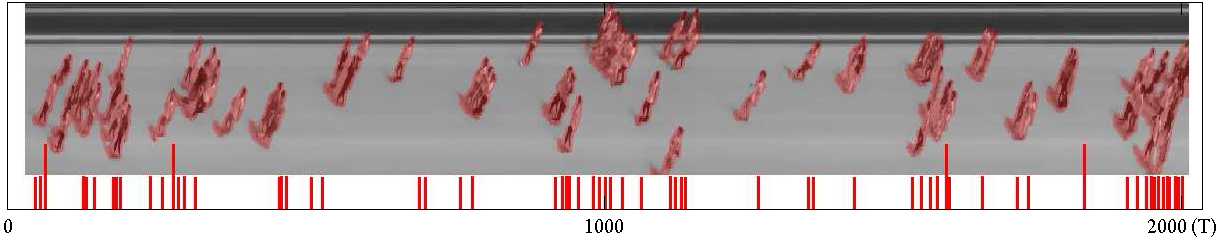
These are results of instantaneous count estimationon for the 2000 frames with temporal slice image.
The system was trained on 800 frames.
Cumulative count resuls
These are the plots of the cumulative counts over time on the testing set (1200 frames).
right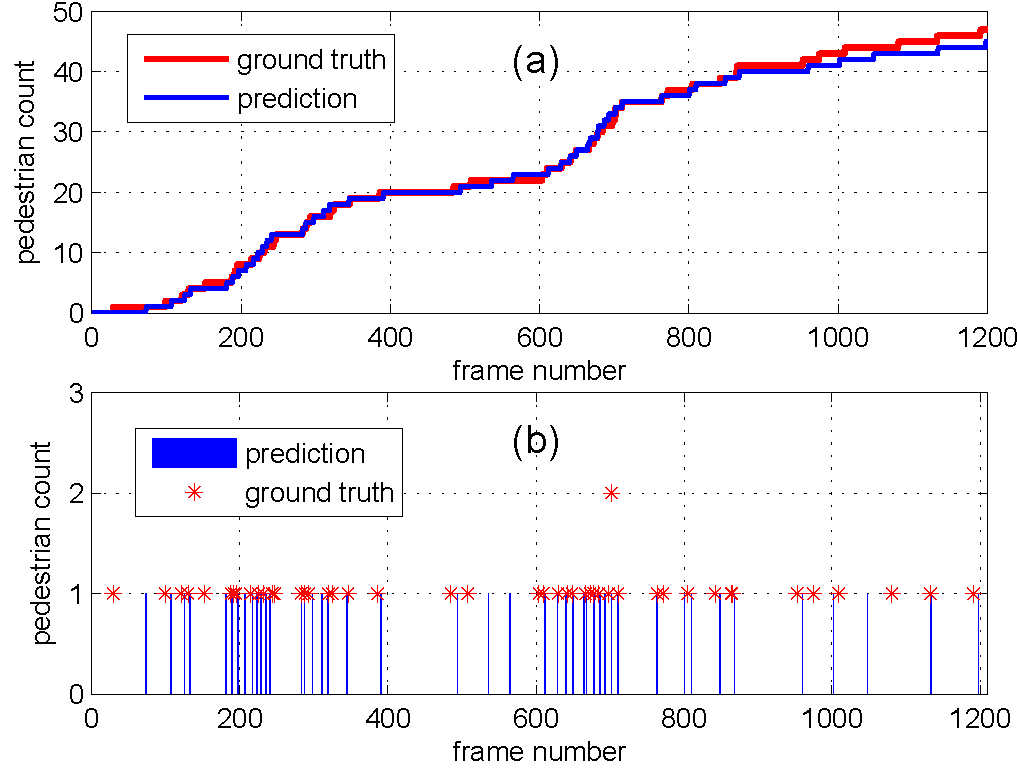
|
left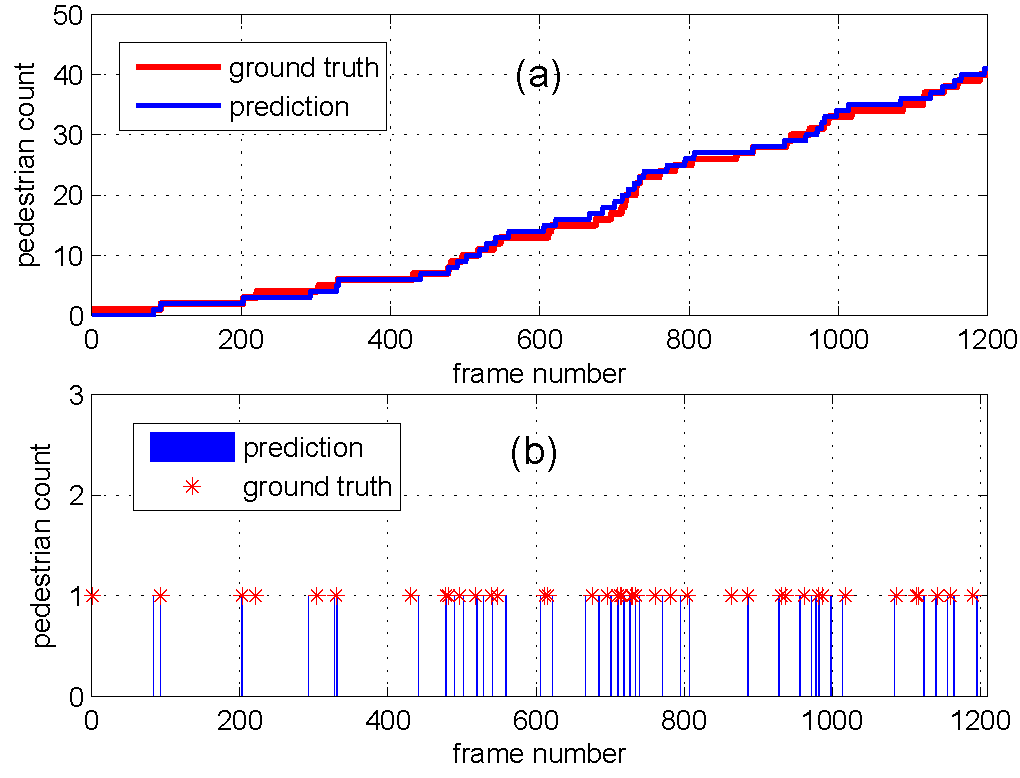
|
2. Results for LHI Dataset
video 3-3 LHI.mov – counting results for the video 3-3 (2000 frames) of LHI crowd dataset, with 1200 frames for testing and 800 frames for training. An example video frame is shown below:
[mov (7.3 MB)]
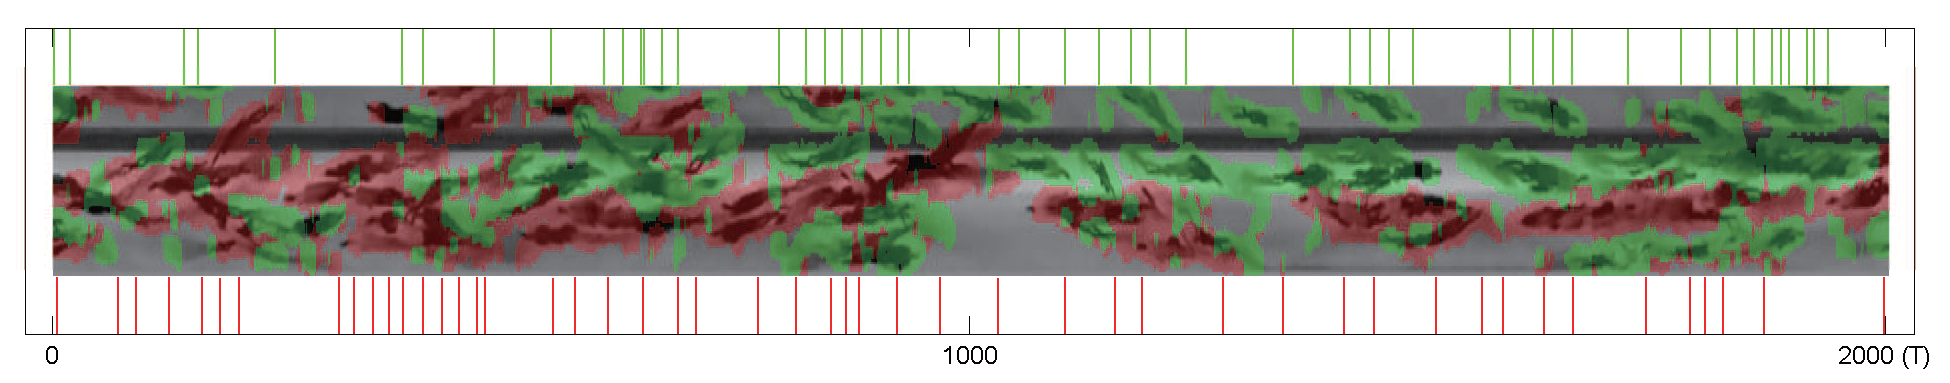
Instantaneous count results
These are results of instantaneous count estimation on for the 2000 frames with temporal slice image.
The system was trained on 800 frames.
Cumulative count results
These are the plots of the cumulative counts over time on the testing set (1200 frames).
right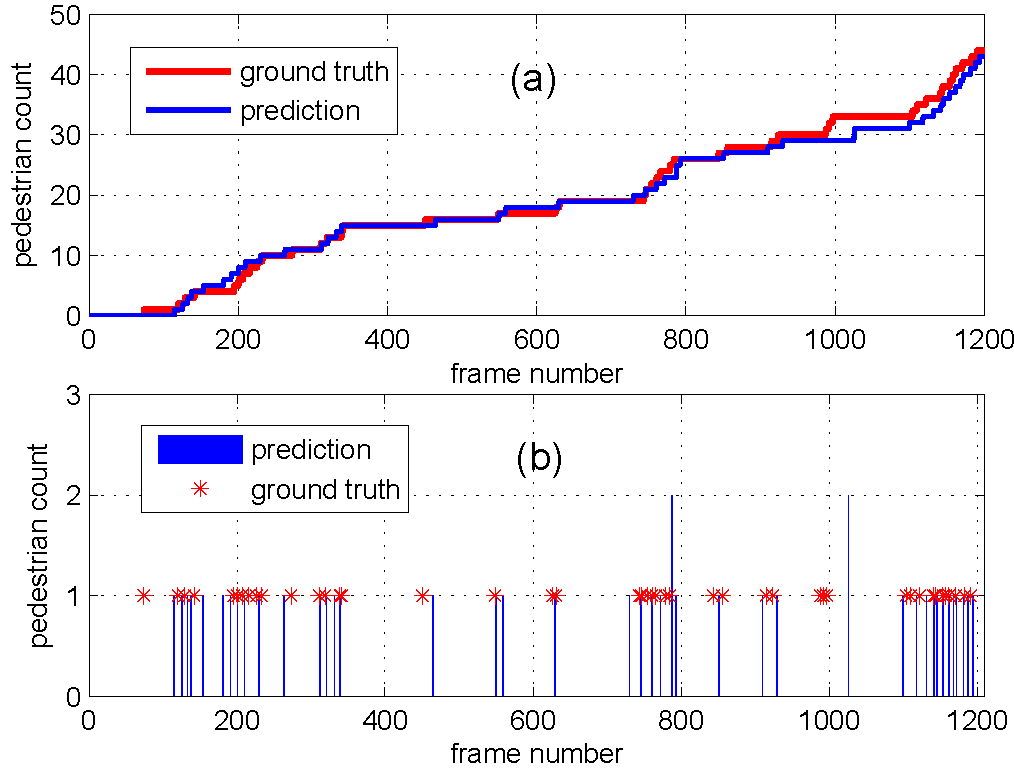 |
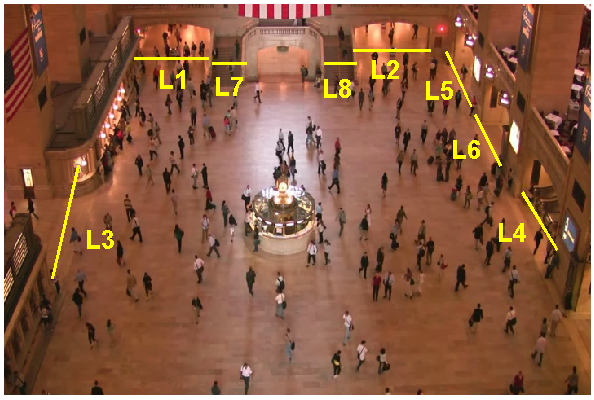
3. Results for Grand Central Dataset
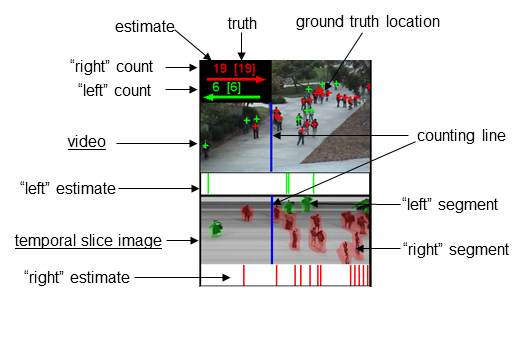
The video is collected from the inside of the Grand Central railway station in New York. The yellow lines are the Lines-of-interest for our line counting algorithm. One example of the video is shown below:
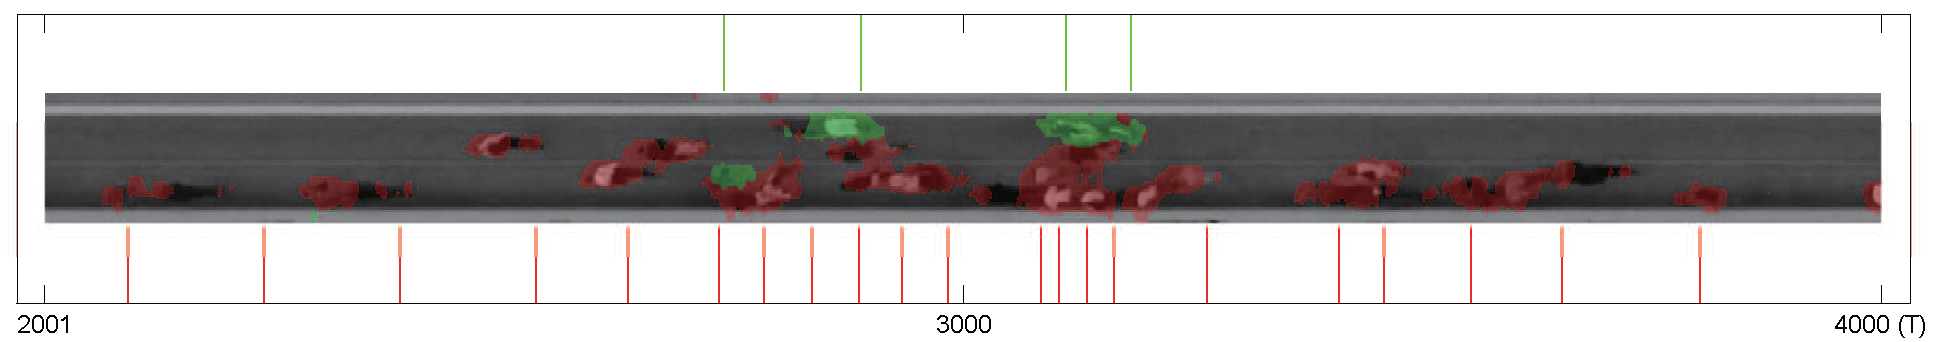
Instantaneous count results
|
L1 frame 1 to 2000
 |
|||
|
L4 frame 6001 to 8000
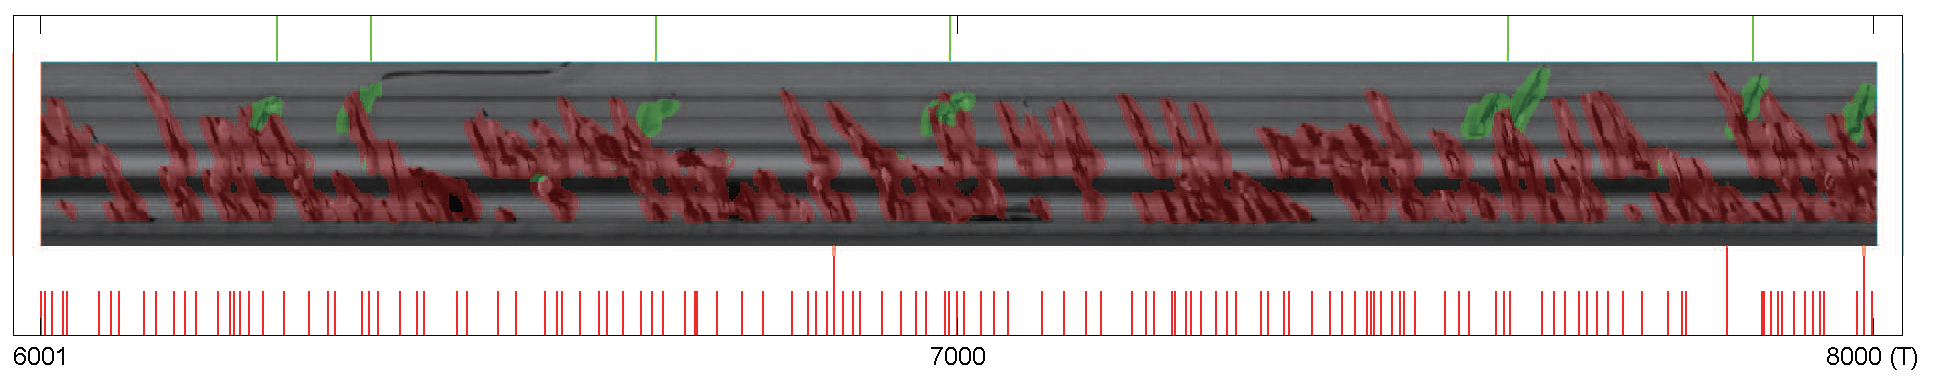 |
|||
|
L8 frame 2001to 4000
 |
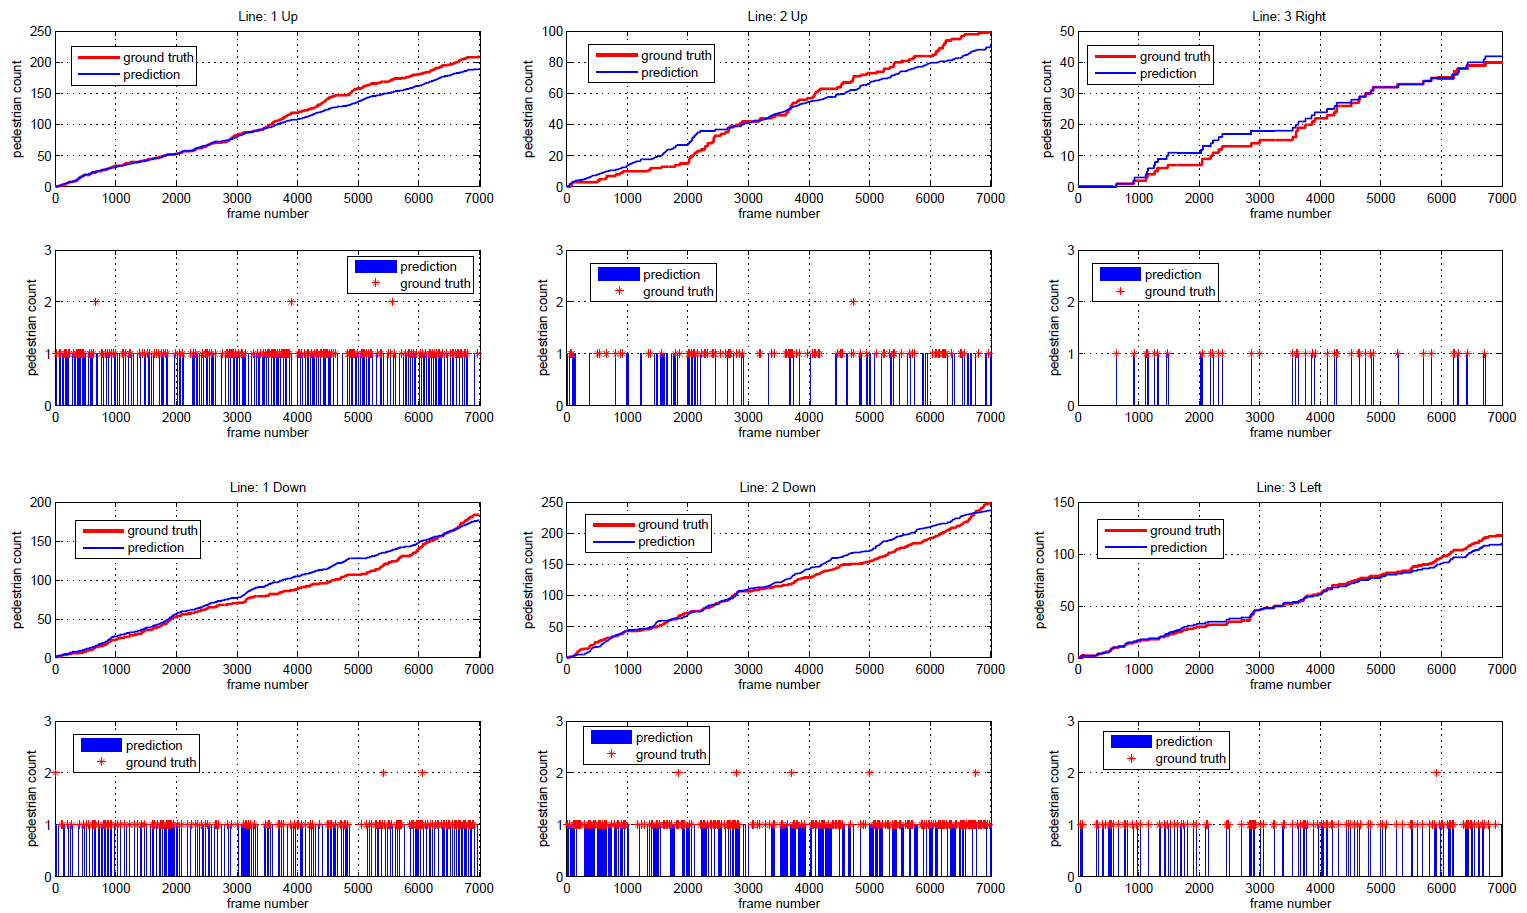
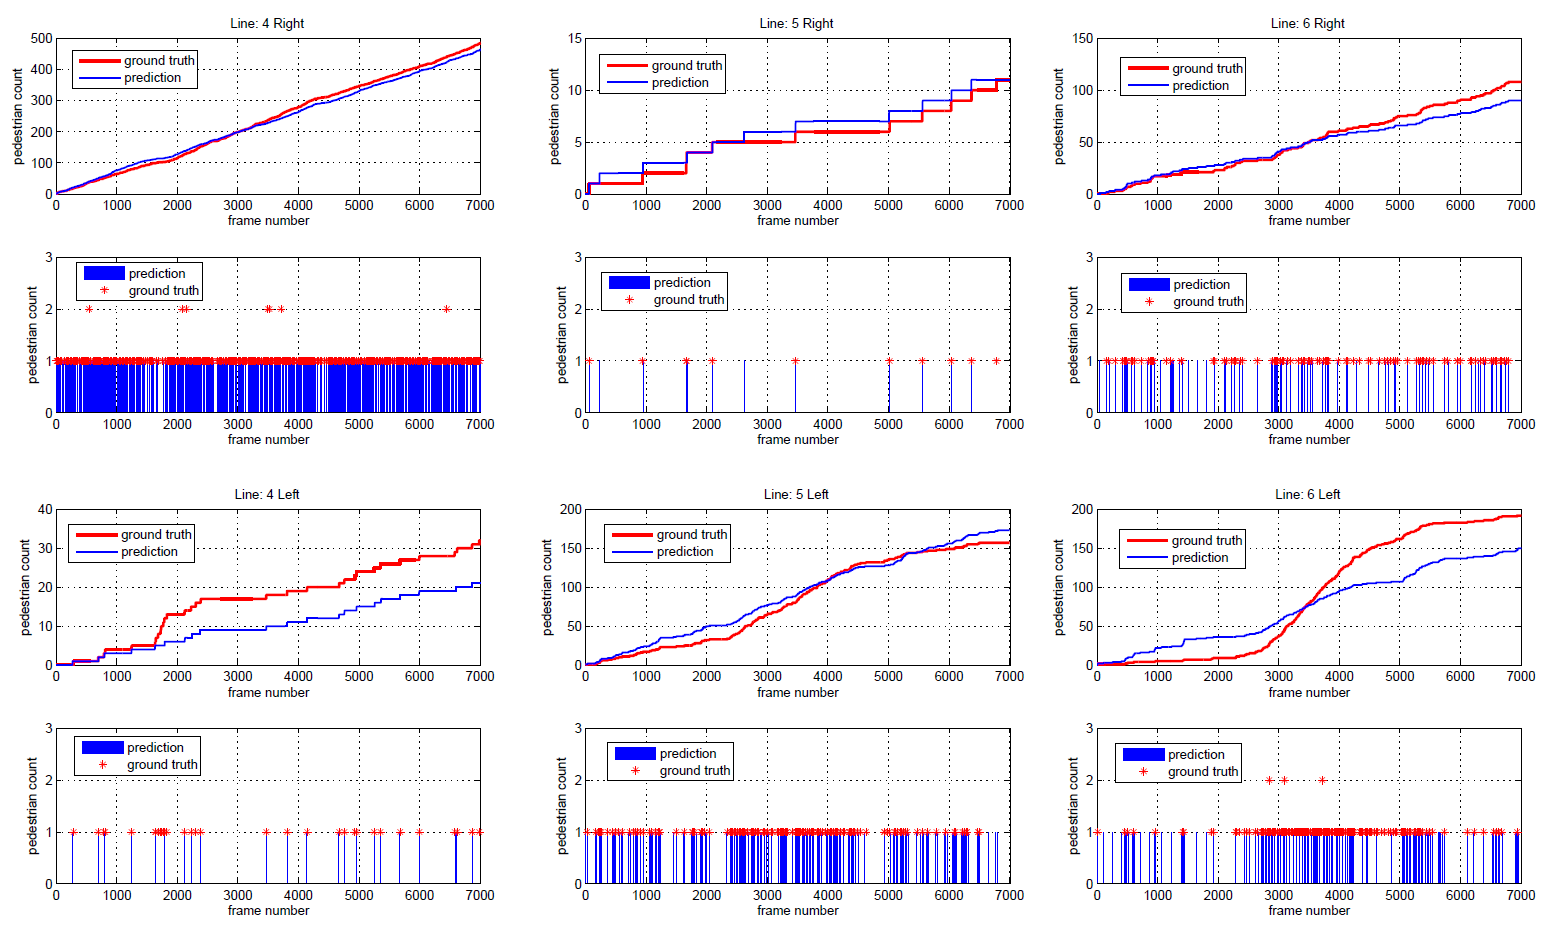
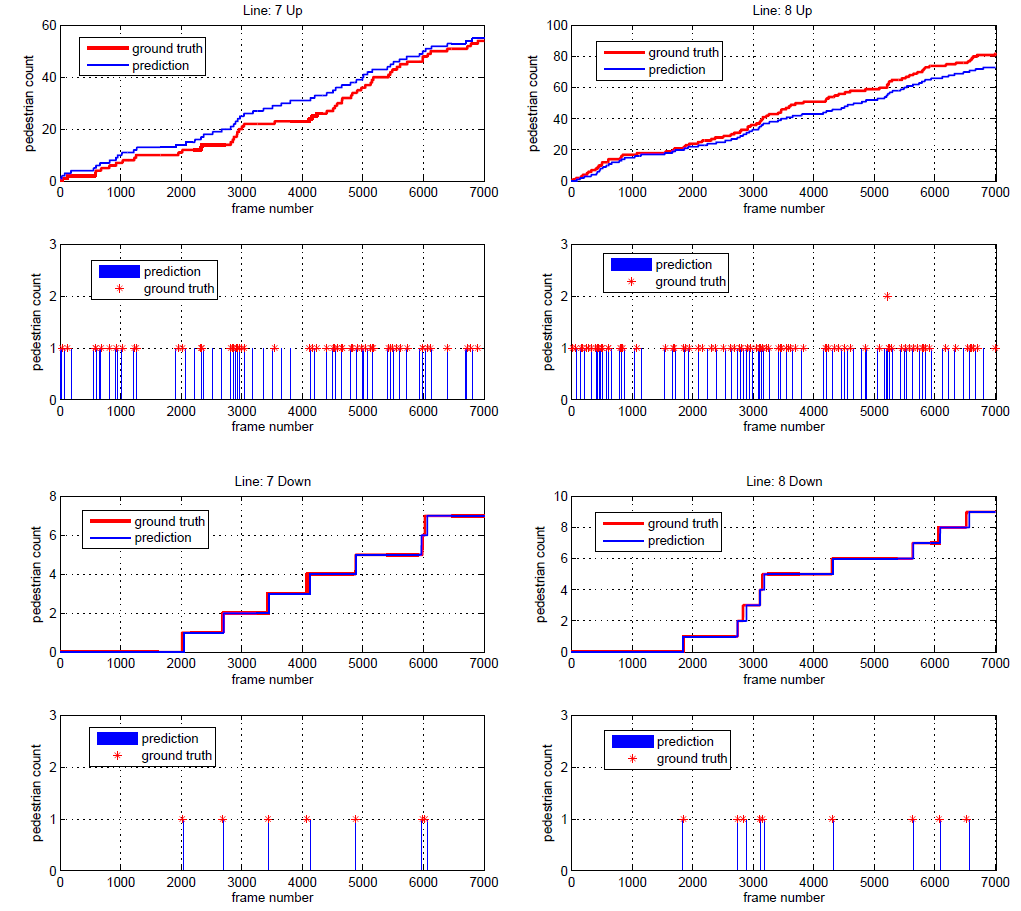
Cumulative count results
The cumulative counting results for L1 to L8 on Grand Central datasets over testing set (7000 frames)