Robustness of Noise-Robust Loss
- Visualization of response maps and tracking results predicted from models trained with different loss functions and noise levels. The noisy GT bounding box and true GT position are denoted as cyan and blue colors. The results obtained by our proposed NR loss and the original BCE loss are represented as red and green colors.

- Noise = 50: visualization of response maps and tracking results predicted from models trained with different loss functions. The noisy GT bounding box and true GT position are denoted as cyan and blue colors. The results obtained by our proposed NR loss and the original BCE loss are represented as red and green colors.

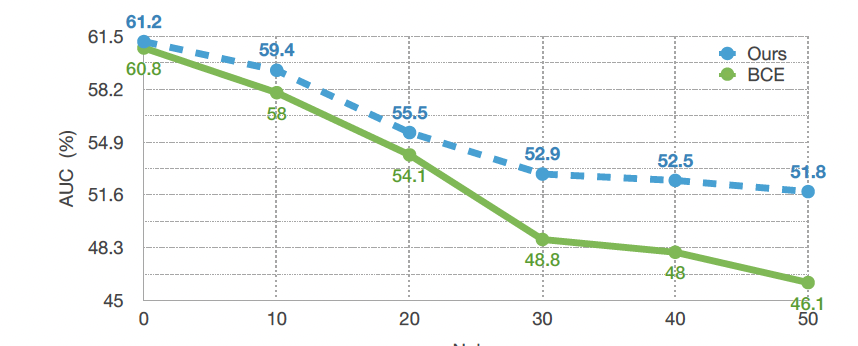
- Quantitative Evaluation: Tracking results (AUC) when training with different amounts of spatial annotation noise (in pixels) using traditional binary cross entropy (BCE) loss and our noise-robust loss.